


Olympic winners
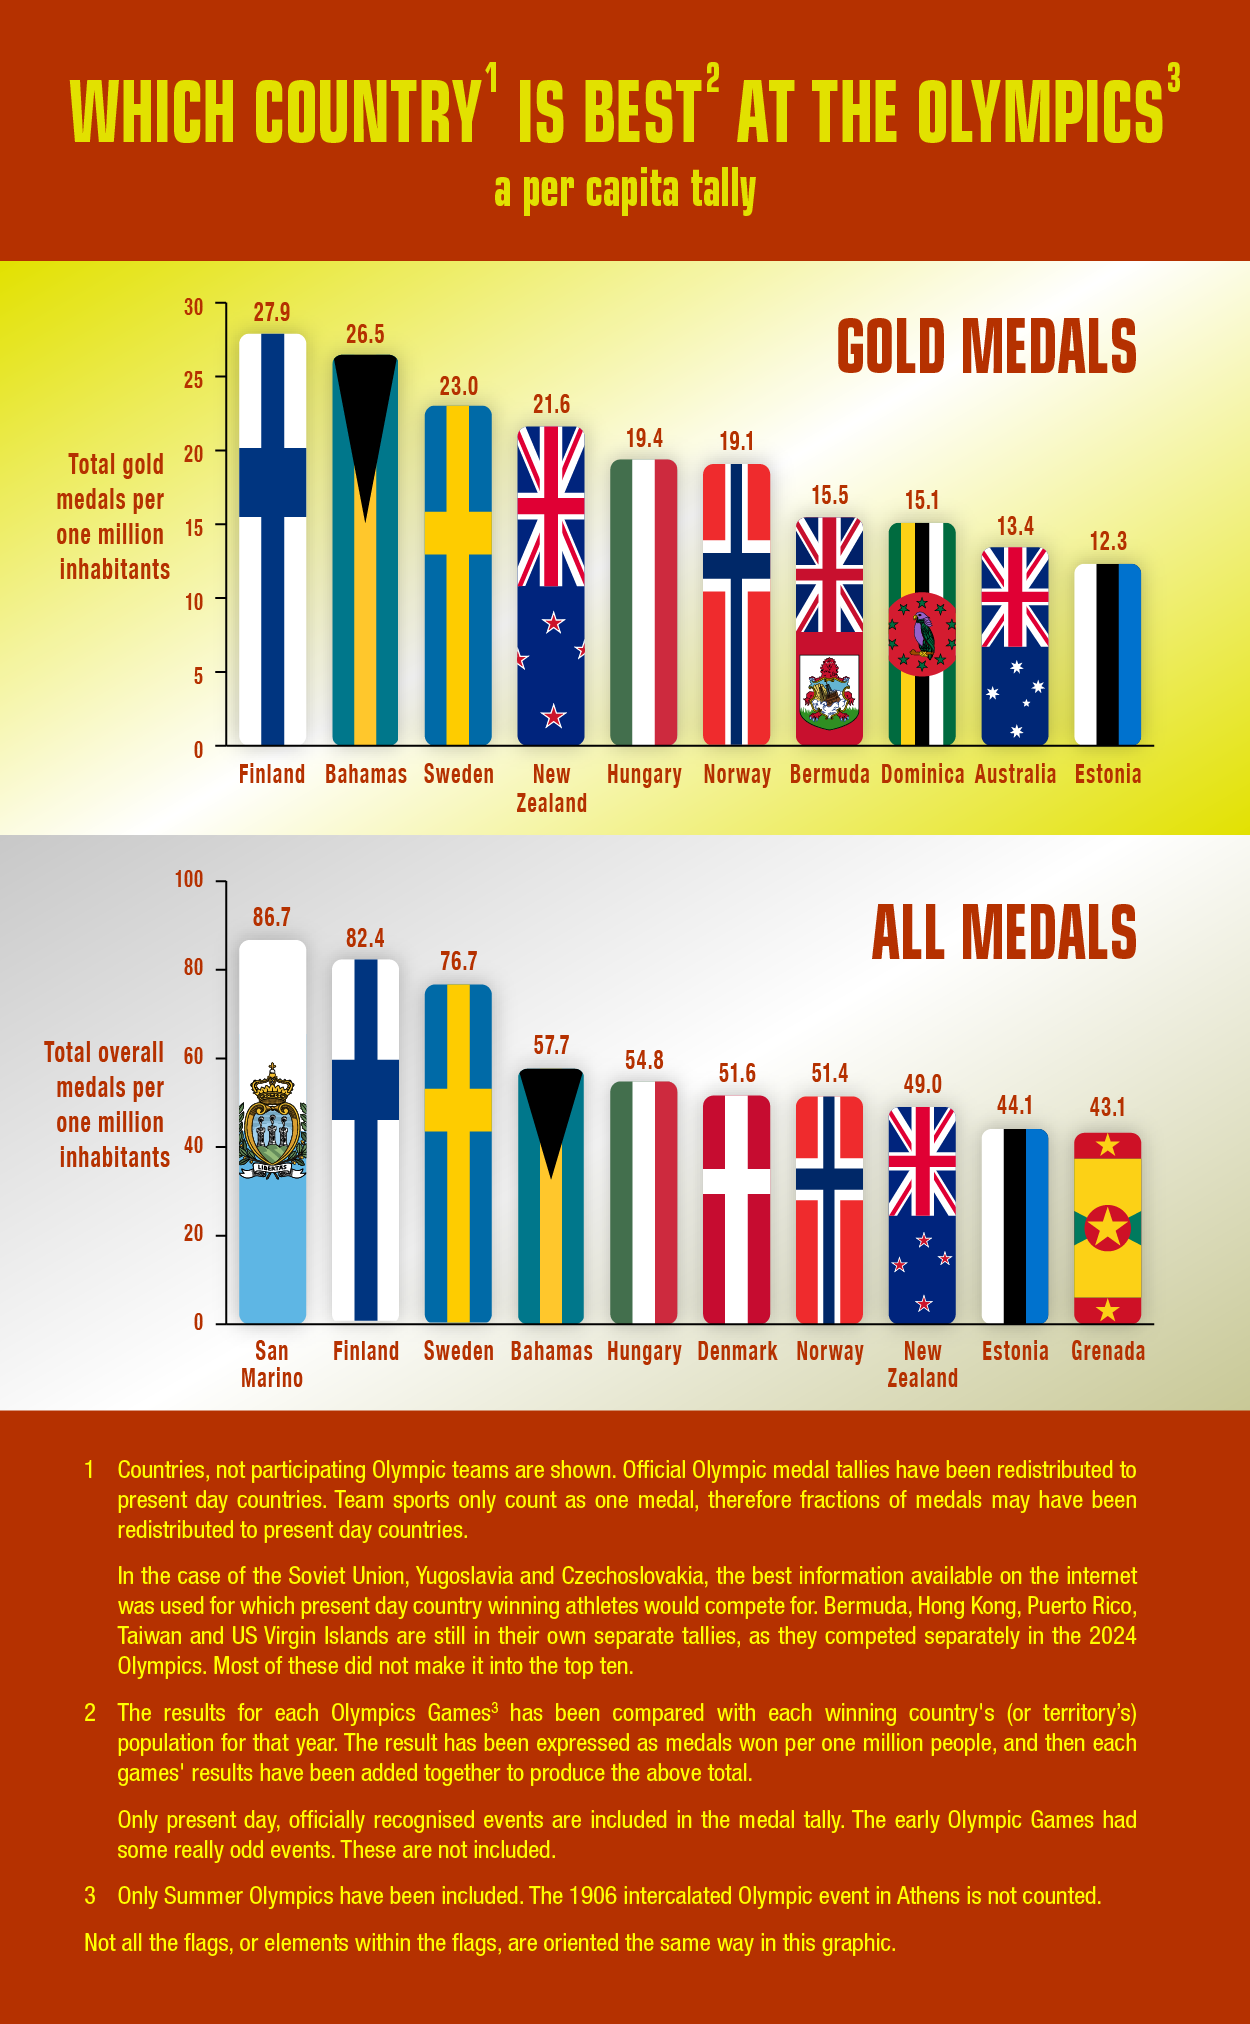
This chart was inspired by the below article.
These are the ten best pound-for-pound breadwinners of the Atlanta Olympics.
| Country | medals won | One medal for each: | |
| 1. | Tonga | 1 | 106,000 people |
| 2. | Bahamas | 1 | 276,000 |
| 3. | Jamaica | 6 | 408,000 |
| 4. | Australia | 41 | 440,000 |
| 5. | Cuba | 25 | 447,000 |
| 6. | Hungary | 21 | 488,000 |
| 7. | New Zealand | 6 | 591,000 |
| 8. | Belarus | 15 | 689,000 |
| 9. | Namibia | 2 | 770,000 |
| 10. | Netherlands | 10 | 814,000 |
At the leaner end of the table are: | |||
| Russia | 63 | 2,341,000 people | |
| United States | 101 | 2,606,000 | |
| Great Britain | 15 | 3,904,000 | |
| Japan | 14 | 8,945,000 | |
| China | 50 | 24,140,000 | |
| Indonesia | 4 | 49,601,000 | |
| India | 1 | 935,487,000 | |
Also there is this website that has attempted to do the same calculations (and more).
andybarefoot.com/olympics
The Start of the Sprinters' Dash
For the 1964 Tokyo Olympics, one of the four official posters was called The Start of the Sprinters' Dash. Designed by Yusaku Kamekura and photographed by Osamu Hayasaki, using Japanese and American servicemen (who were stationed in Japan). It is the iconic poster of that games.
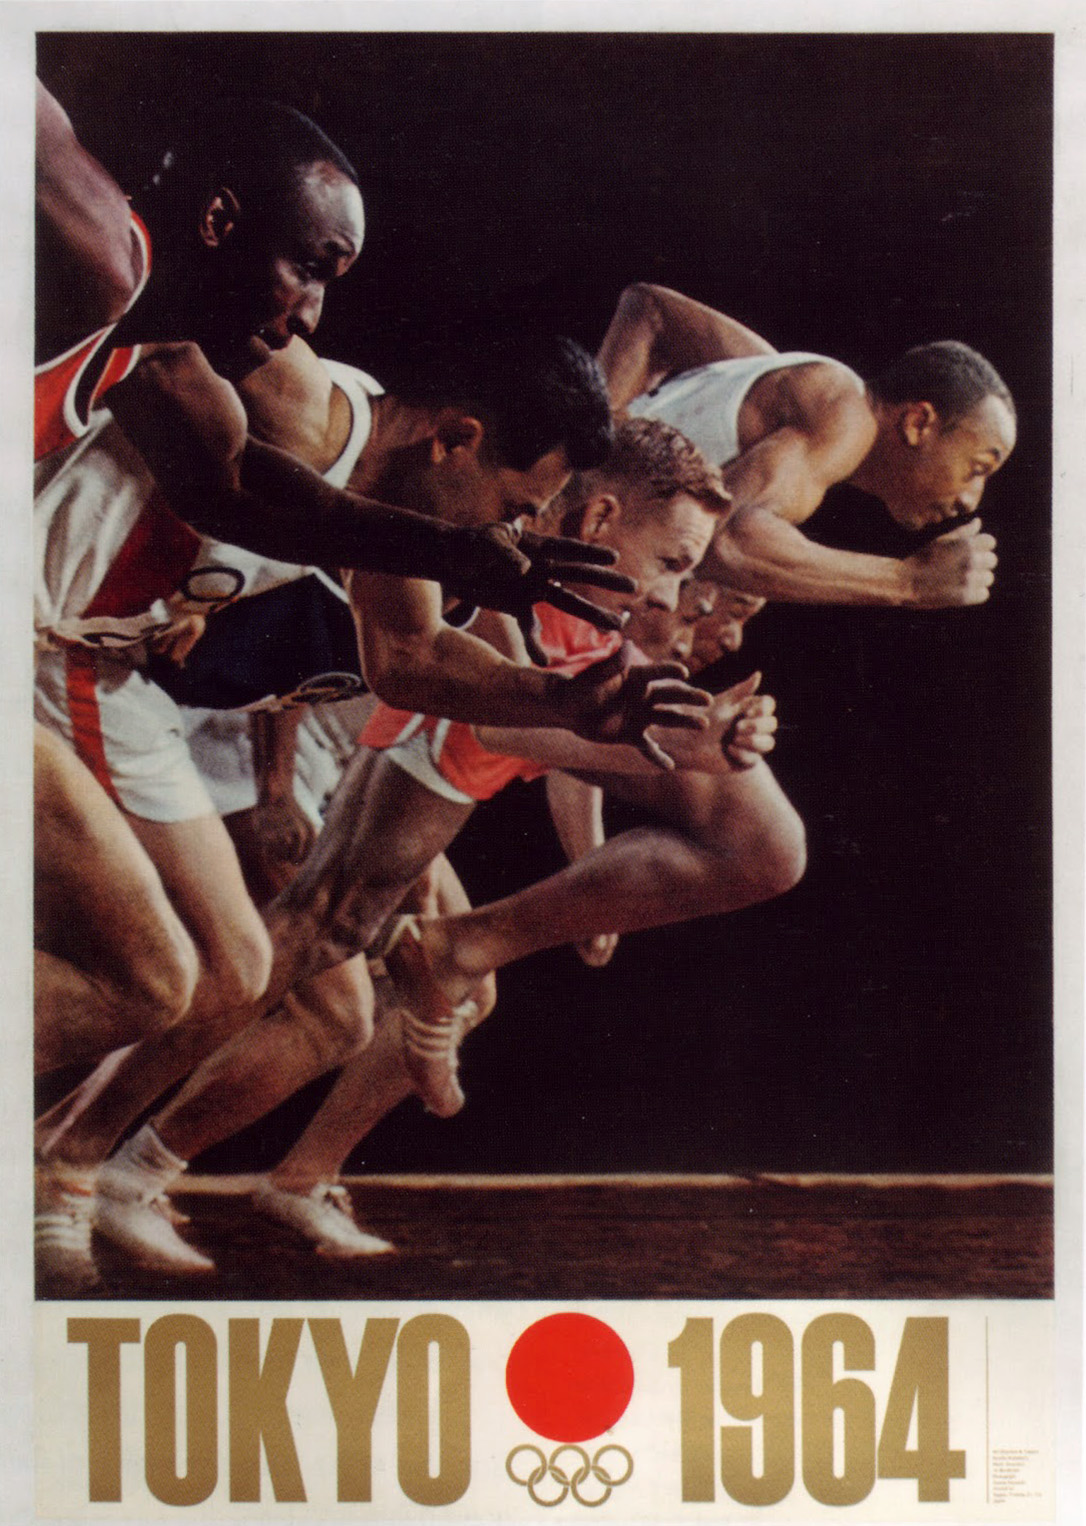
Fast forward to 2016, and the Japanese presentation at the Rio Olympics, for the upcoming 2020 Tokyo Olympics. In the video part of this presentation, they assembled athletes of all sports, and for one freeze frame made a modern interpretation of that original 1964 poster.

You can see the whole video section here, and that freeze frame at 00:58.